Building Scalable Ecommerce Product Comparison Tables
Building Scalable Ecommerce Product Comparison Tables
Stop manually updating static charts. A data-first playbook to building scalable, dynamic product comparison tables that drive conversion and reduce returns.
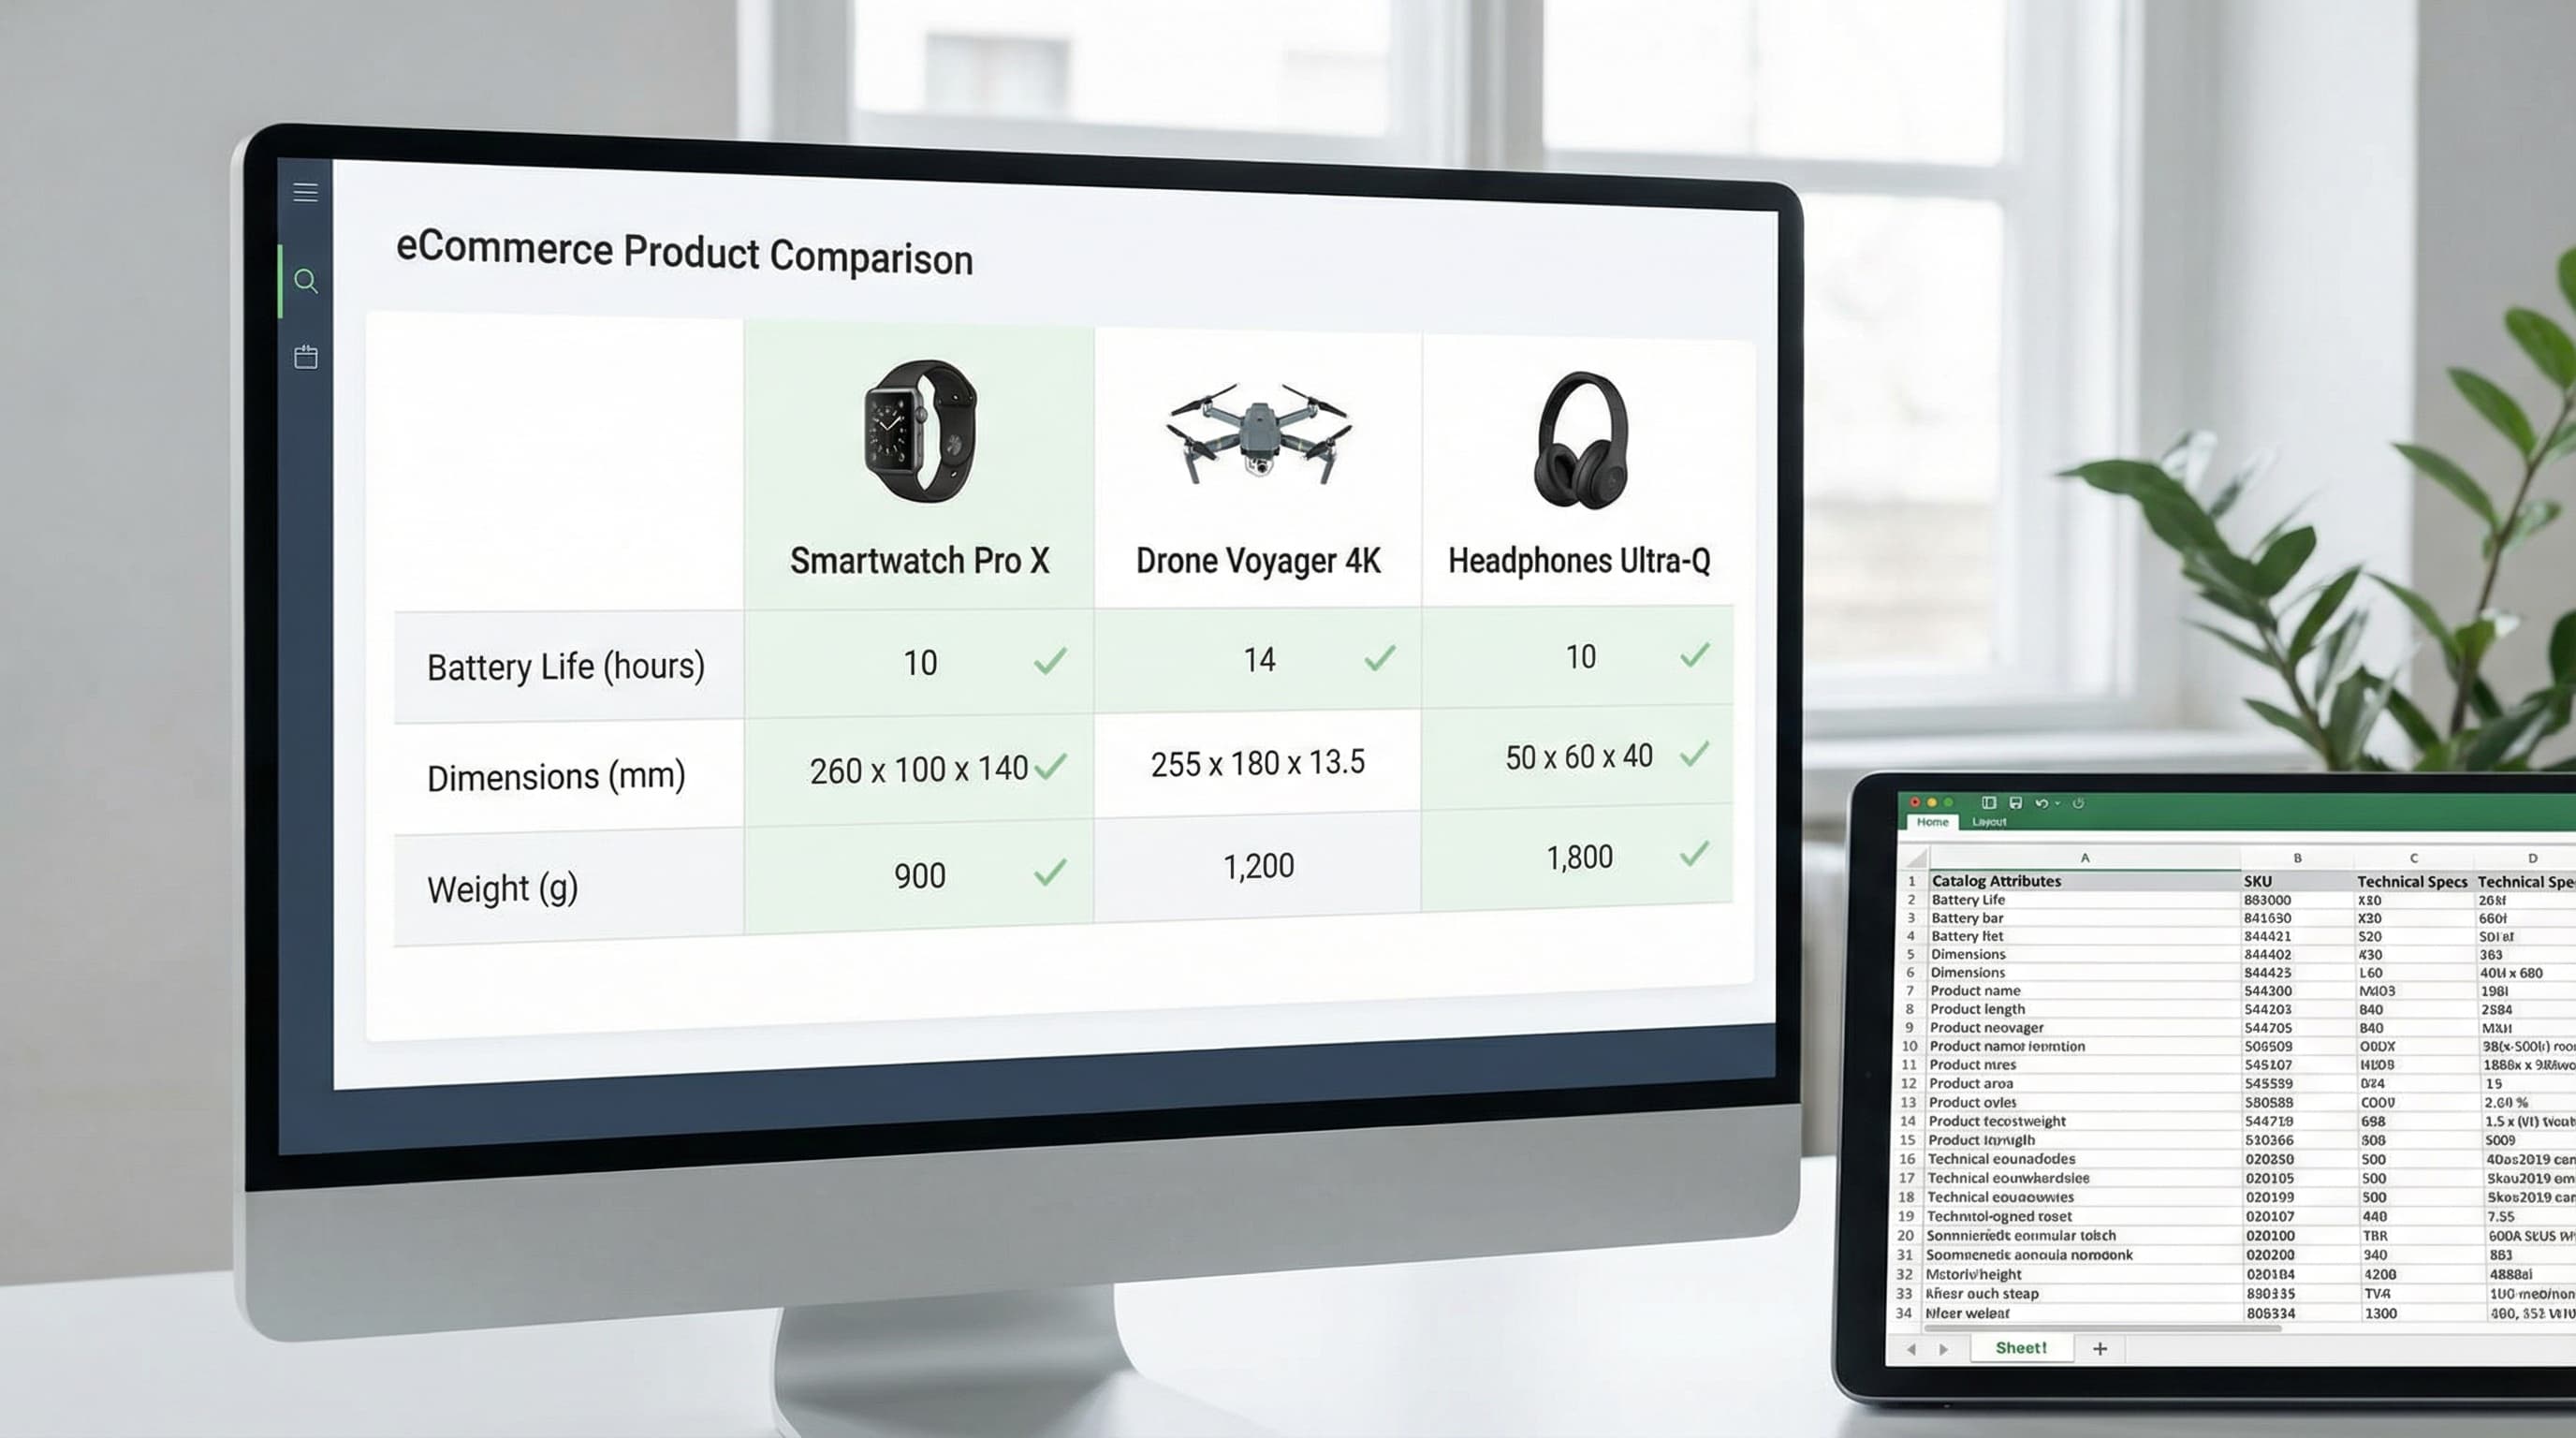
Product comparison tables are the practical antidote to choice paralysis on product pages. When built from catalog attributes, they present consistent, comparable facts that speed decisions, reduce returns, and increase conversion by making trade-offs visible instead of hidden.
Choice overload in online shopping leads to decision fatigue and higher abandonment. A data-first product comparison table approach treats the table as a live view over the attribute model, not a static block of handcrafted copy. This keeps specs accurate as inventory and variants change and prevents conflicting claims between listings and feeds. Research on explainable product comparisons highlights the importance of structured decision support.
How this matters in practice: A table sourced from canonical attributes in your PIM (Product Information Management system) or catalog feed reduces returns by aligning expectations with product reality. The same attribute set can power PDP modules, collection comparison slices, and marketplace exports, so content work is done once and reused.
Strategy: When to Use Product Comparison Tables
Deploy product comparison tables when shoppers face real trade-offs or overloaded choice. A data-first comparison built from catalog attributes scales better than manual charts and reduces returns by surfacing objective spec differences early.
Identify high-choice categories
High-choice categories need structured comparisons because customers solve for attributes, not just brand. Focus on verticals with complex specs such as consumer electronics, beauty with ingredient trade-offs, B2B and industrial where compliance and compatibility matter, and categories with many SKUs and frequent feature churn.
Combine catalog attribute depth from your PIM with operational signals such as returns and support tickets to prioritize categories. A practical threshold is to tag categories that expose more than five decision attributes in your attribute model and show a return rate above baseline. Avoid building tables for low-choice, simple categories where attribute detail adds noise rather than clarity.
Define table types and scope
Different shoppers need different levels of detail and framing to decide efficiently.
Model-to-model matrices: Best for technical buyers (e.g., laptops, industrial parts).
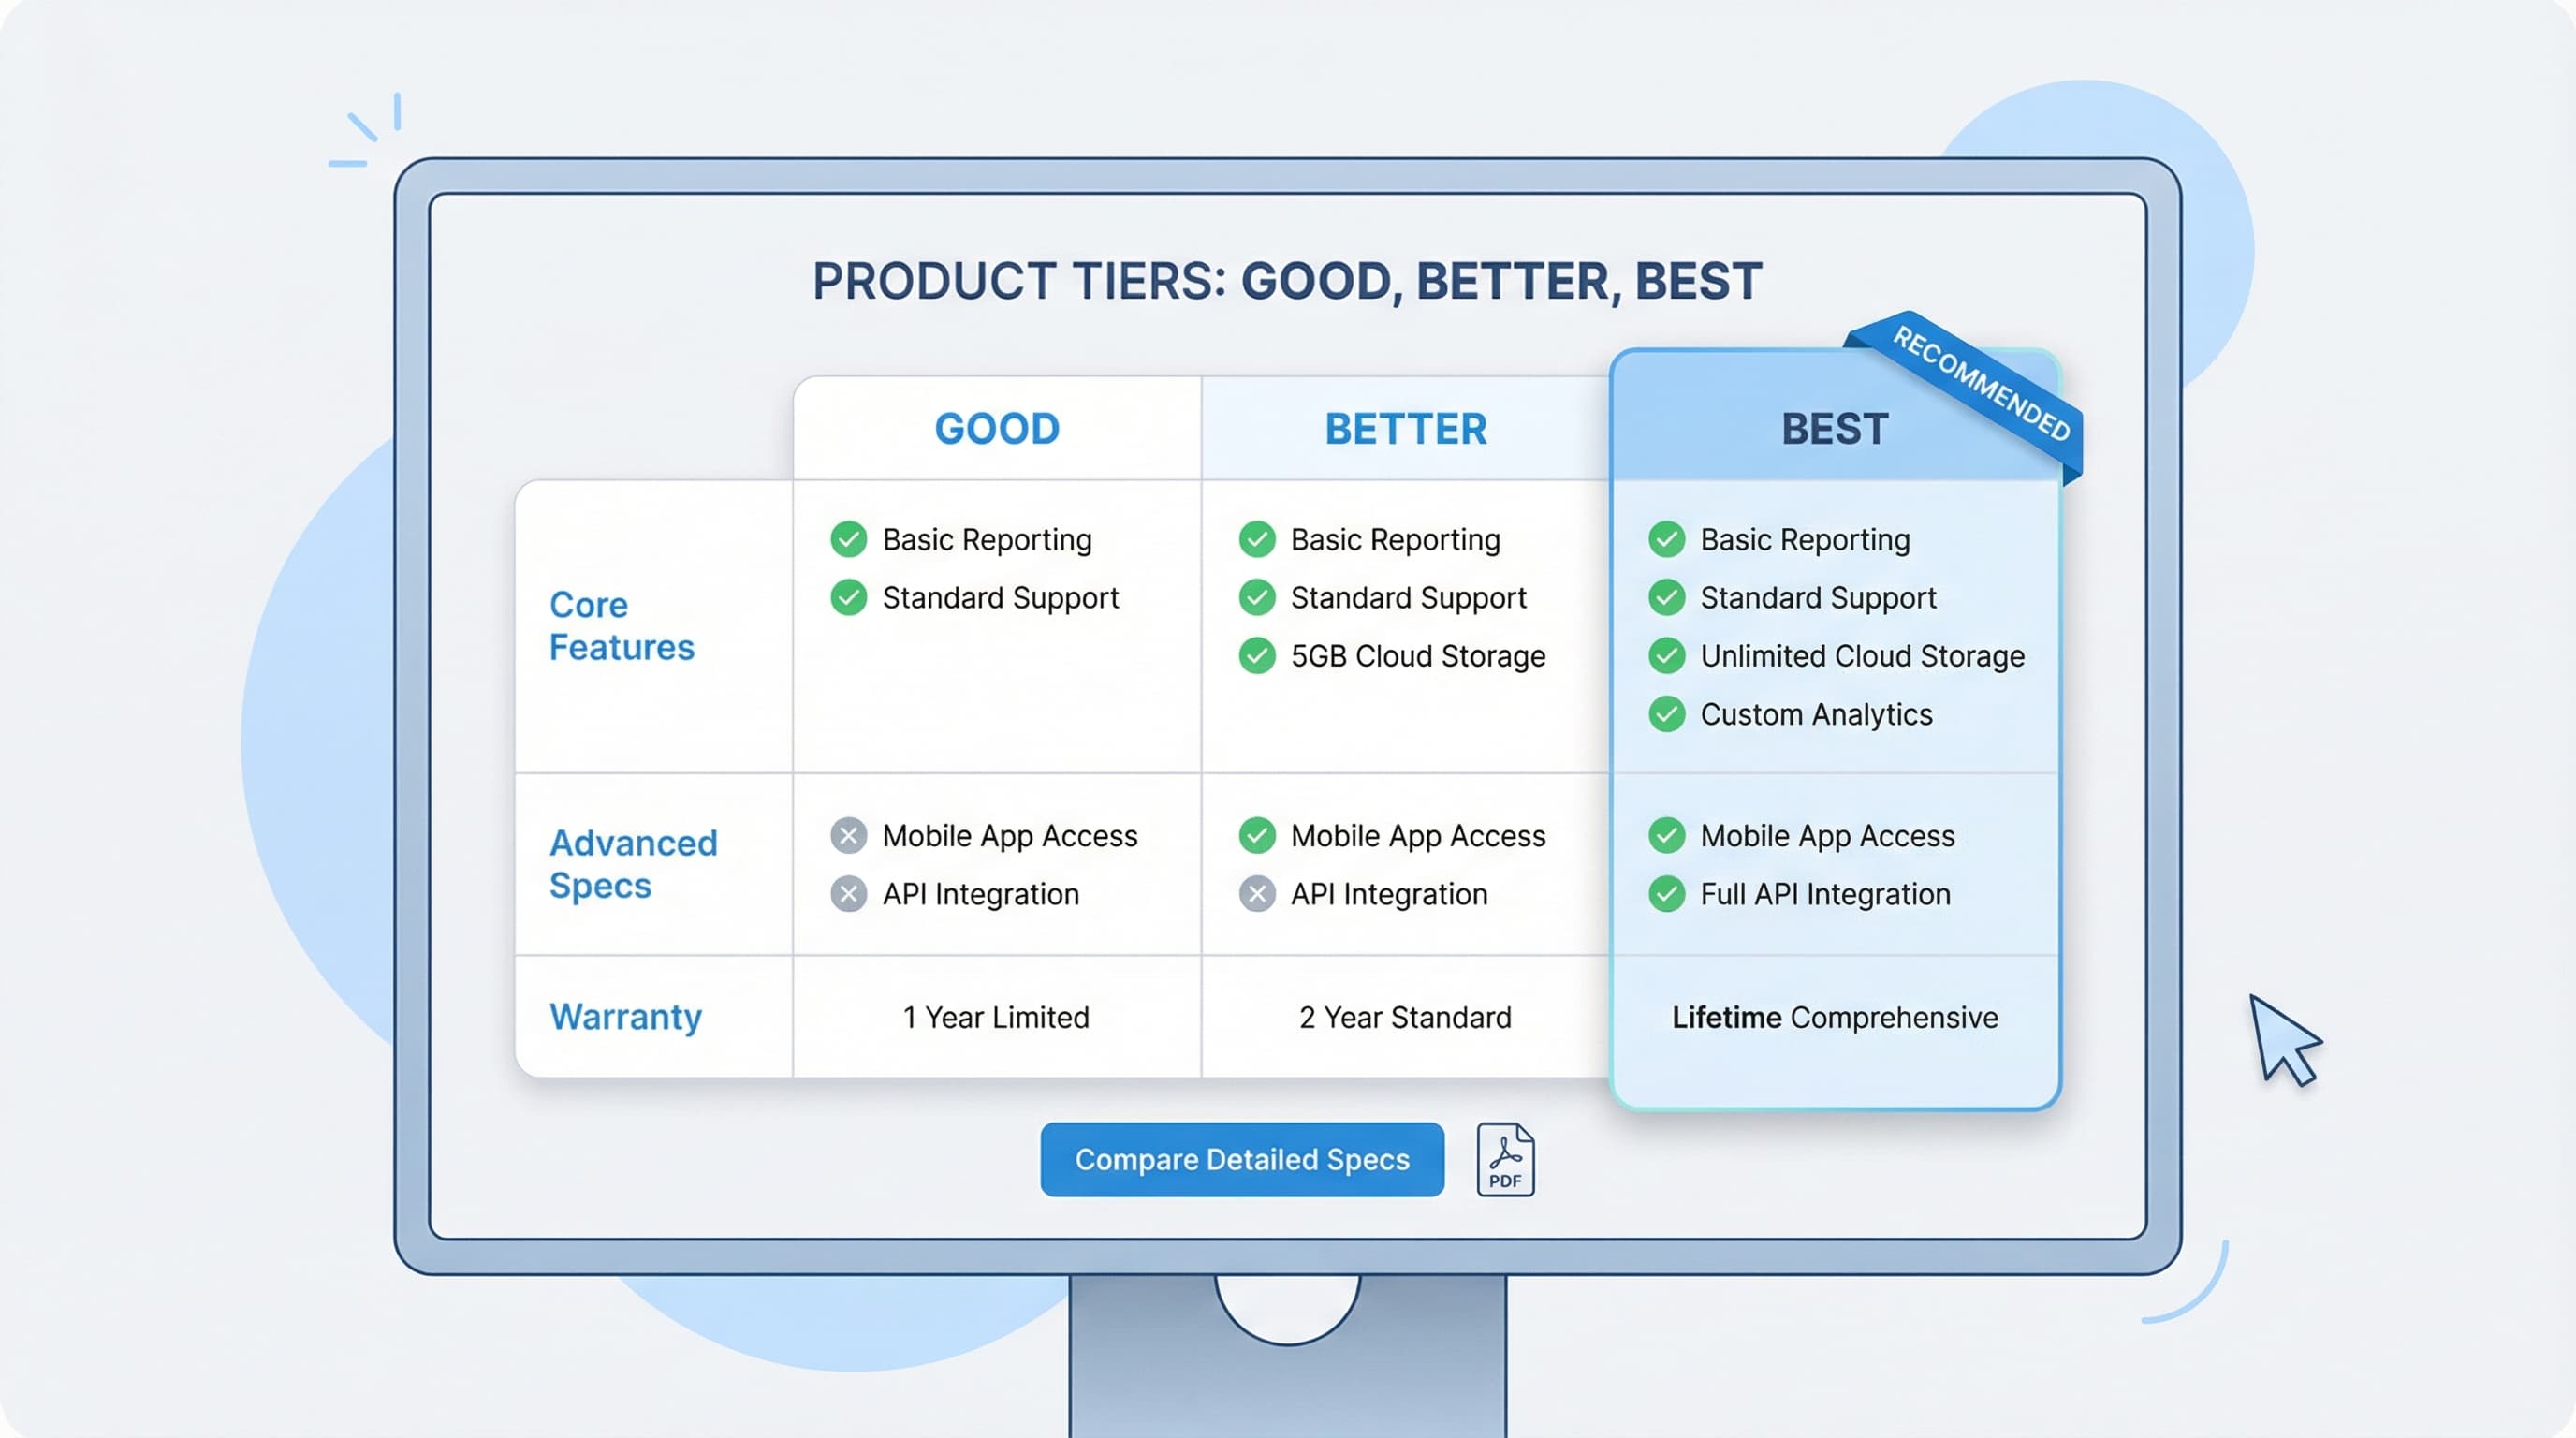
Good/Better/Best modules: Ideal for shoppers wanting quick guidance on top sellers.
Pull rows from canonical attribute fields in your PIM or product feed so the comparison is driven by a single source of truth rather than manual copy.
PIM: A system to centralize product attributes and ensure consistent data across channels.
Shopify Metafields: Per-product custom fields used to store structured attributes important for rendering tables.
Product Feed: An export format that syndicates structured attributes to marketplaces.
UX placement strategy
Placement affects user intent and conversion because the depth and timing of comparison matter. Place concise "good/better/best" tables on the PDP above the fold or in a visible comparison tab for quick decisions. Reserve full matrices for category landing pages or a comparison hub for deep research. Link compact PDP tables to the hub so users can expand into a model-to-model view.
For deep dives on UX patterns, Baymard Institute provides extensive guidance on product detail needs and decision fatigue.
The Data Model: Turning Features into Comparable Attributes
Product comparison tables are only as useful as the data behind them. To build scalable, dynamic product comparison tables that drive conversion and reduce returns, treat features as structured attributes, not free text. Structured attributes enable deterministic sorting, faceting, and automated table generation across PDPs, collections, and marketplace exports.
Why product comparison tables need structured attributes
Structured attributes turn marketing copy into typed fields that front-end components, feeds, and PIMs can consume. If you use Shopify, a metafield acts as a key-value pair to store typed custom data on products, making attributes retrievable at scale.
Defining an attribute schema
A clear schema prevents ambiguity across categories and suppliers. Create a category-aware attribute model. Define an ID, name, data type, unit, allowed values, and scope for each attribute. Keep attributes atomic: separate the numeric value from the unit.
Example attribute entry:
ID:weight
Type:number
Unit:gram
Scope:global
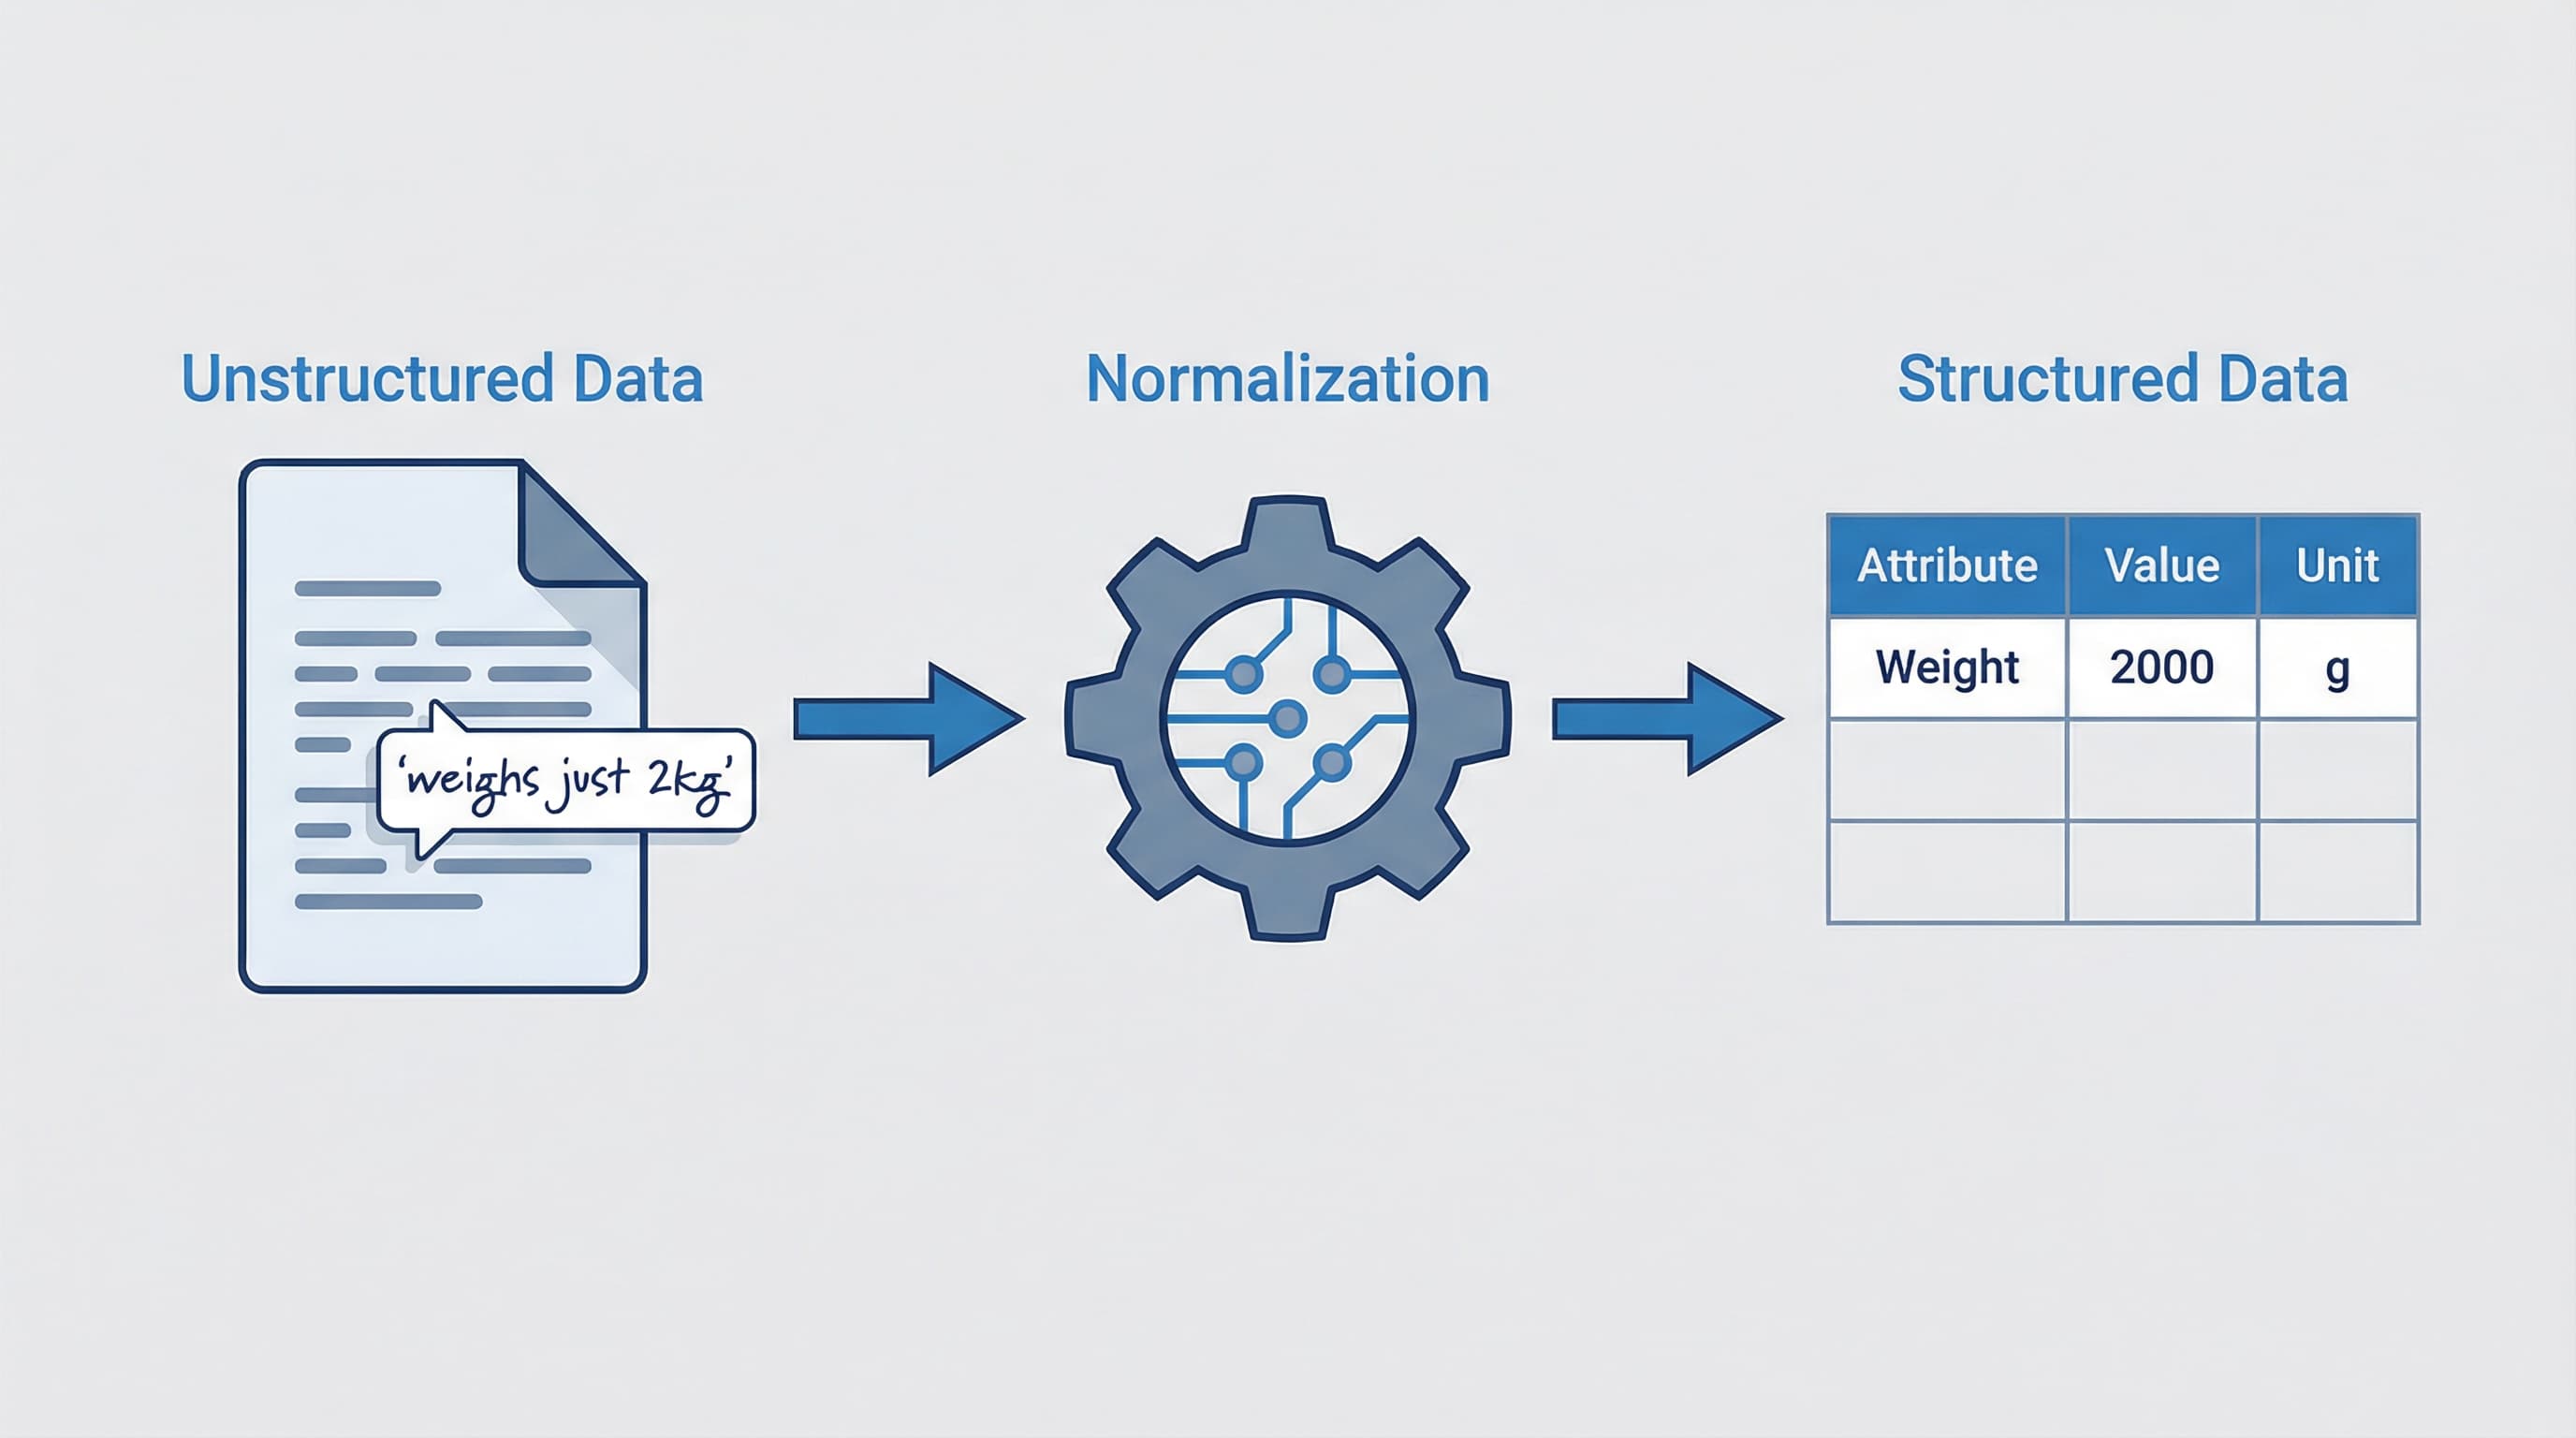
Units and normalization
Unit mismatch is a common source of misleading comparisons. Store a canonical numeric value plus a unit code. Normalize on ingest to a canonical unit per dimension (e.g., convert lengths to millimeters). Persist the original unit for display and keep a small conversion table with audit logs.
Example: Transform "1.5 meters" to "1500 millimeters". Store canonical value 1500, unit millimeter.
Booleans and enumerations
Booleans and enums enable clear yes/no comparisons and faceting. Use explicit boolean types for binary features and enumerations for multi-option attributes. Map supplier terms to your controlled vocabulary using lookup tables. Use null for "unknown" rather than false to avoid false negatives.
Example:
Attribute:water_resistant
Type:boolean
Values:true, false, unknown
Handling missing data and fallback policies
Missing values degrade trust and can increase returns if shoppers assume features exist where they don't. Define a fallback policy per attribute and channel. Options include displaying "N/A", hiding the attribute, or inferring with conservative defaults (annotated with source and confidence for internal QA).
QA checklist to prevent misleading specs
Lightweight automation and sampling reduce costly corrections. Automate validations for types, units, ranges, and enumerations. Add human review for high-impact attributes and track exceptions. For example, flag a product if battery capacity falls outside expected bounds.
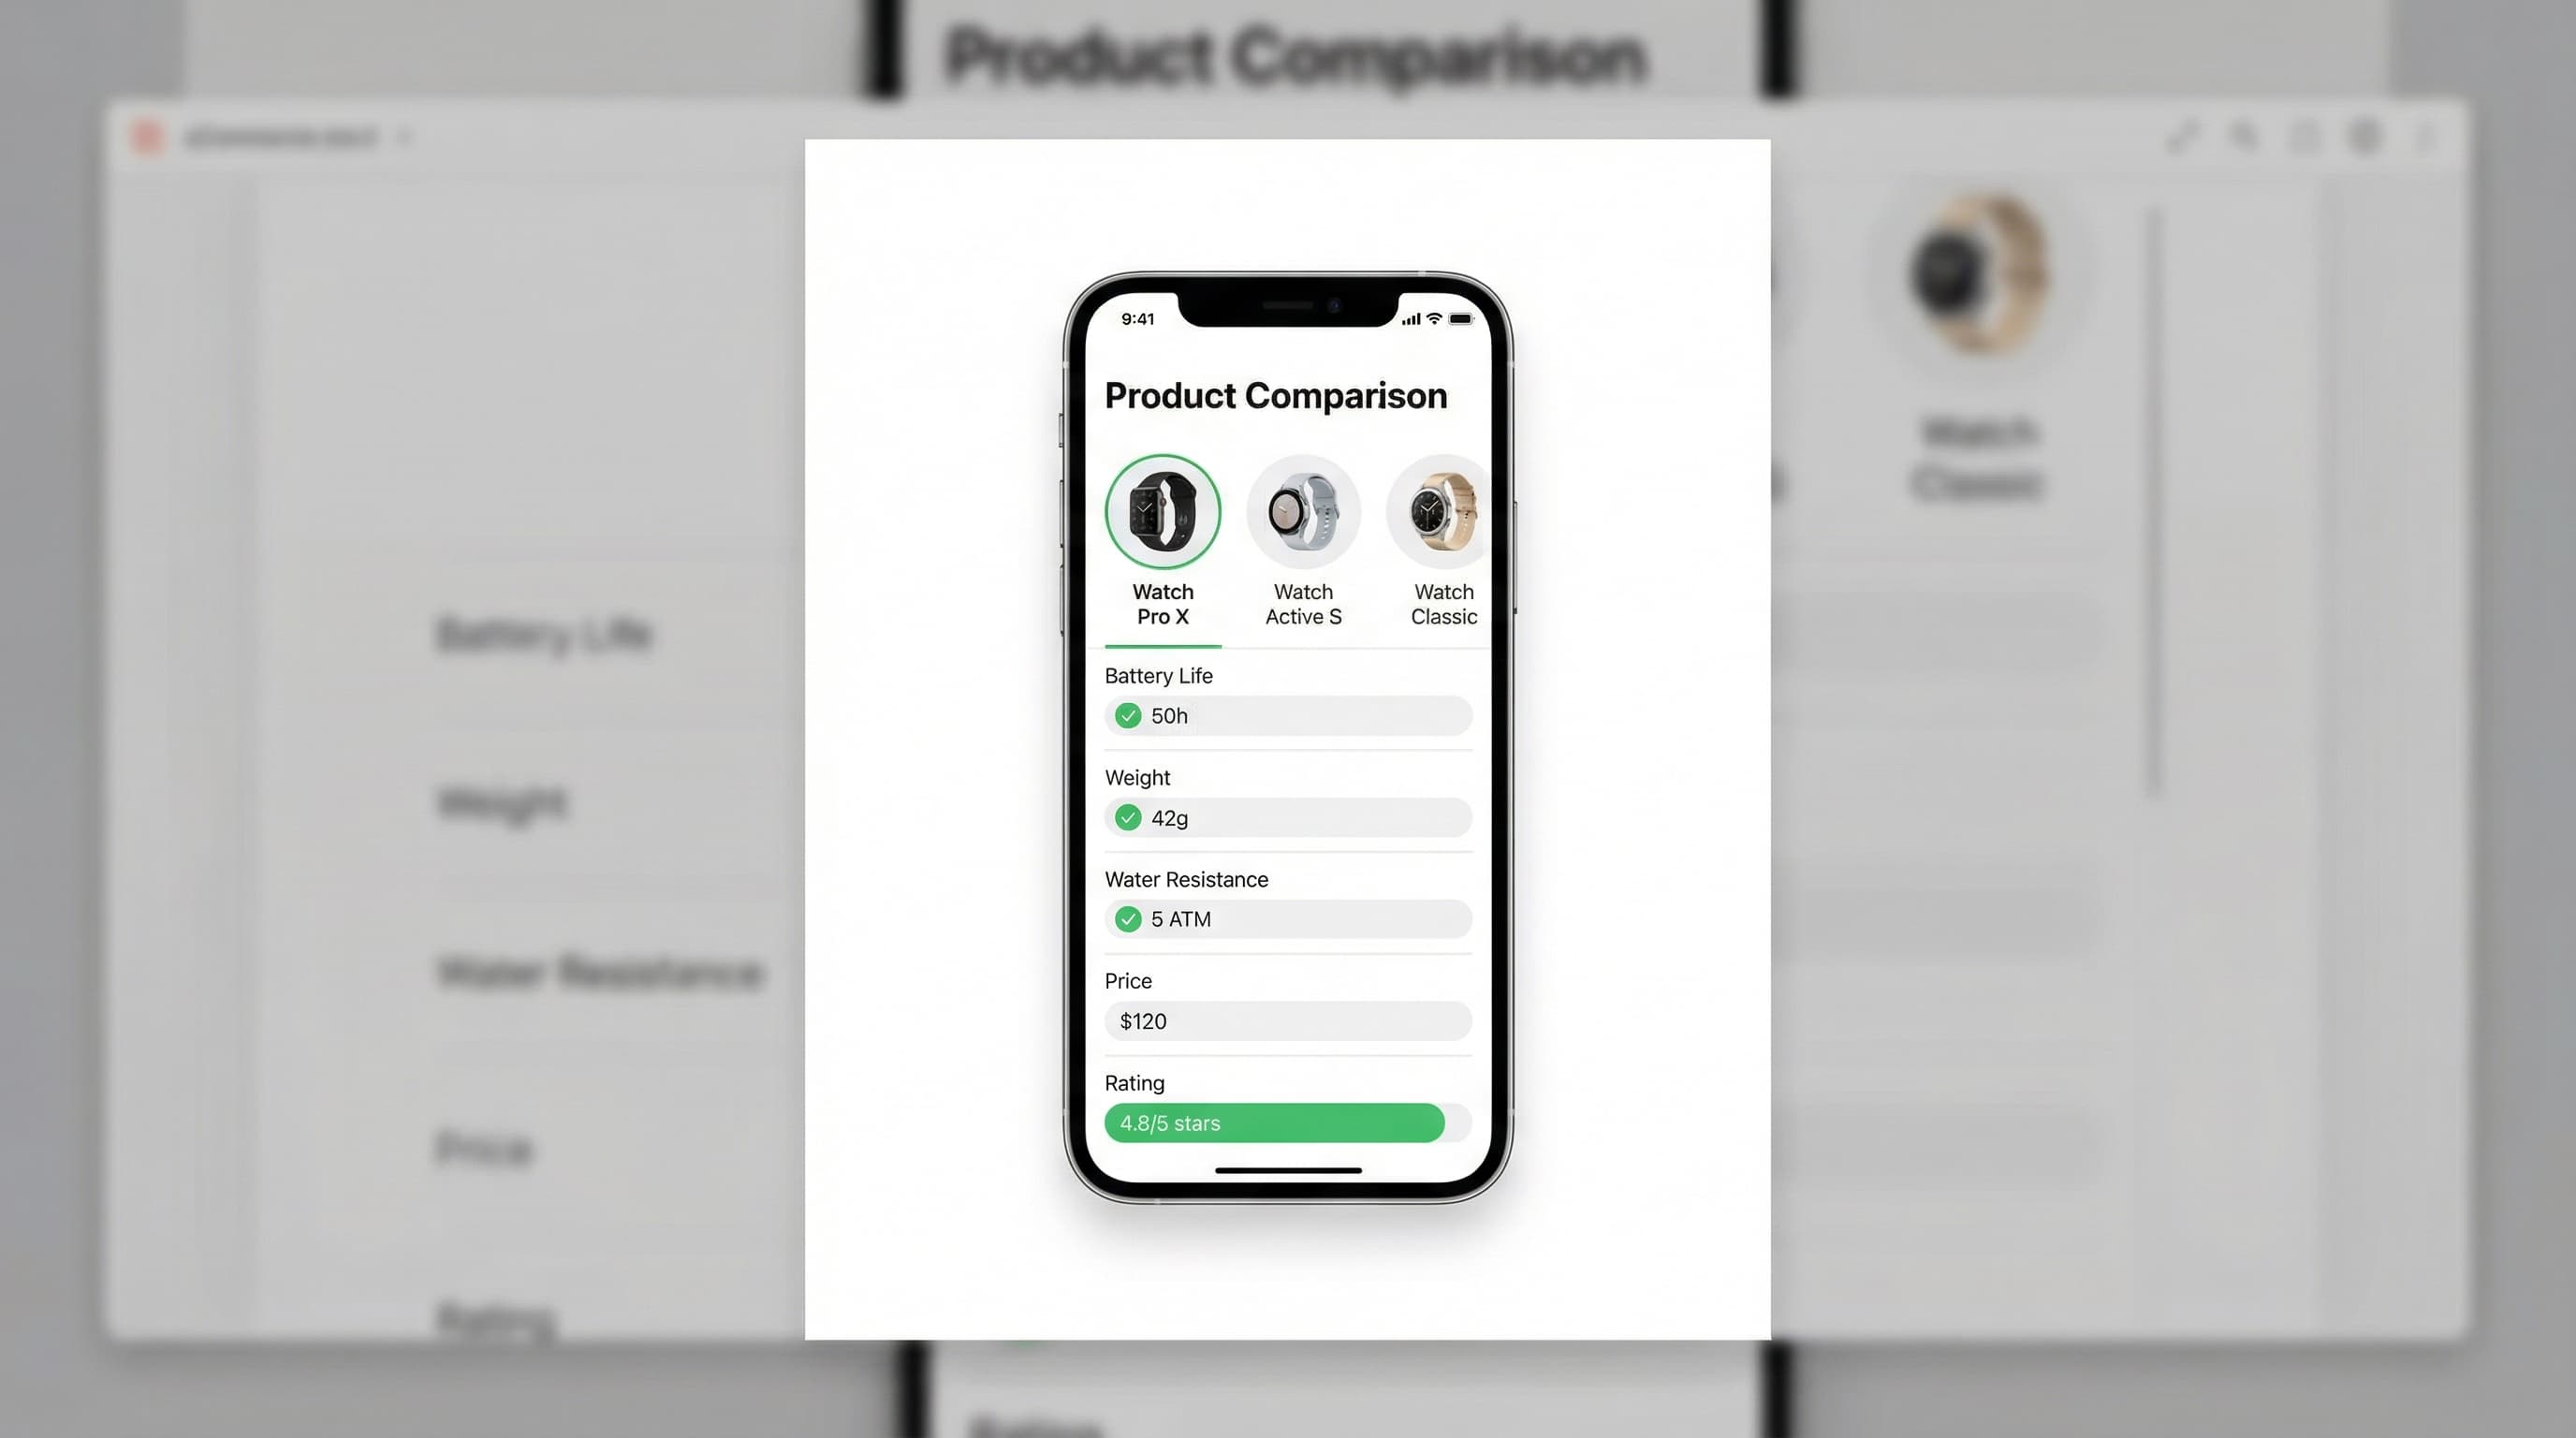
Designing for Conversion: Mobile and UX Patterns
Product comparison tables must be data-driven and designed to reduce decision friction.
Mobile responsiveness
Most sessions happen on mobile, so tables must reflow without hiding key specs. Use stacked cards for narrow screens or horizontal swipe with a pinned product name column. Prioritize three decision attributes on small viewports and offer an expand control for full details. Progressive disclosure keeps the initial presentation scannable while preserving the full dataset for users who want to deep dive.
Sticky headers and column alignment
Users need orientation when scanning long matrices. Pin the header and the left product column to maintain context while users scroll or swipe. Use proportional cell widths and subtle separators so values align across rows. Test sticky behavior on both iOS and Android and keep touch targets large.
Highlighting differences versus similarities
Shoppers decide faster when contrasts are obvious. Emphasize differing cells with a color tint or increased weight, add inline badges for unique features, and provide a toggle to show "only differing rows." Use brief microcopy to explain why a difference matters so users do not misinterpret small variances.
Reduce cognitive overload
Dense tables cause choice paralysis. Group attributes into named categories (e.g., Performance, Dimensions, Warranty), surface a compact summary row with the top decision criteria, and use icons for recurring attributes. Apply progressive disclosure to reveal details on demand and link each claim to the canonical spec source to improve trust.
Scaling Production with AI and Catalog Ops
This section explains how to operationalize building product comparison tables from structured catalog attributes using AI and automation. Focus on pipelines that extract attributes, apply normalization rules, and generate short human-readable explanations.
Attribute extraction pipeline
Getting consistent attributes is the foundation of reliable comparison tables. Use a hybrid pipeline that combines rules from your PIM with lightweight extraction models to ingest attributes from suppliers, vendor feeds, and legacy descriptions. Start by defining a canonical attribute model and mapping incoming field names to that model. Track provenance so each cell in a comparison table links back to the source attribute and extraction confidence.
Example: Map vendor field weight_oz and spec_wt to canonical weight_grams and convert units during ingest.
Normalization and canonicalization rules
Normalization turns heterogeneous values into comparable facts. Define transformation rules for units, ranges, booleans, and enumerations. Implement normalization in the PIM or an ETL layer as deterministic functions and log changes.
Example: Normalize sizes like "small", "medium", "large" to numeric size codes while keeping both the original label and canonical code.
Auto-generated spec explanations
Short explanations reduce customer confusion and decrease returns. Generate one-line human-readable clarifications for technical specs using templates and lightweight NLG models. Link each explanation to the original attribute and include a confidence score so QA can prioritize reviews.
Example: For waterproof rating 5 ATM, produce the explanation: "Water resistant to 50 meters; suitable for showering and swimming at surface level."
From pilot to full catalog
Start small with a high-impact category, validate conversions and return rate deltas, then expand using automated mapping. Ensure your QA checklist covers verified unit conversions, standardized boolean values, and reviews for low-confidence automated explanations.
From Excel Prototypes to Dynamic Implementation
Start by prototyping product comparison tables in Excel to validate which attributes drive conversion before building a dynamic PIM-driven component. Spreadsheets are fast for stakeholder sign-off, but static templates fail as SKUs grow.
Prototype the data structure in Excel
Excel lets teams agree on canonical rows and attribute types before engineering work begins. Create a canonical columns sheet with attribute name, type, unit, source, and priority. Use data validation to enforce controlled vocabularies and a sample rows sheet with representative SKUs to surface edge cases early.
Map attributes to PIM and Shopify metafields
Mapping prevents manual copy and enables dynamic rendering across channels. Build a mapping matrix from the Excel canonical columns to PIM attribute IDs and Shopify metafield namespaces. This reduces ambiguity and prevents unit mismatches when exporting to marketplaces.
Example: Excel attribute weight mapped to pim.weight_g and shop.metafield.product.weight_grams.
Implement QA and reuse the dataset
Incorrect specs increase returns and harm trust. Add validation rules, a QA checklist with sampling rules, and a publish gate that blocks products with missing mandatory attributes. Implement the comparison table as a component that reads attributes dynamically from PIM or metafields so the same dataset feeds PDP modules, collection filters, and marketplace exports.
Governance: QA Checklist and Success Metrics
Product comparison tables must reflect authoritative catalog attributes to avoid misleading shoppers.
Attribute source audit
Verify where each spec is sourced and who owns it. Map each comparison column to a single PIM or system field and track ownership in a living registry. This avoids the error of mapping columns to manual listing text which often drifts.
Data validation rules
Prevent impossible values, mixed units, and formatting errors. Enforce types, units, and normalization in the ETL that builds feeds and metafields. For example, ensure all length values are converted to millimeters before numeric comparison.
Change control and approval
Avoid ad-hoc edits that break comparators and analytics. Gate schema changes behind PRs and require sign-off from the catalog owner and PM. A common error is allowing late, unreviewed edits to attribute types.
Consumer accuracy audit
Reduce returns and complaints by performing monthly sampling that reconciles PDP specs with supplier documentation and warehouse measures. Validate dimensions for a 50 SKU sample to avoid bias.
Success metrics
Track conversion lift from A/B tests, return rate delta for included SKUs, and the mismatch rate between PIM and PDP exports. Research from Salsify emphasizes the need for content accuracy to build consumer trust.
Automating attribute extraction for comparison tables
Building reliable comparison tables fails when data is fragmented across PDFs, messy feeds, and legacy descriptions. ButterflAI detects, extracts, and normalizes product attributes from unstructured sources, ensuring your PIM and Shopify metafields are populated with the clean, structured data needed to power dynamic comparison tables.